Testing and Findings of GDevelop Performance in big projects (More will be added troughout the day, ideas are welcomed)

I started working on a big project with procedural world generation, think 2D Minecraft or Terraria… and one of the first things i noticed was the awful performance.

Bad performance is nothing new to me and i usually find a way around it, but this project is different, i can simply cut content off or rout around it, there needs to a lot going on in the scene…

Hence i decided to get to the bottom of what drives performance and how some stuff actually works.

  • Any and all knowledge about technical limitations or how to improve performance in the engine is more then welcomed!!!

THE TESTING GROUNDS

My new game will be all about world generation, so ill be testing in a similar manner to test the limits.

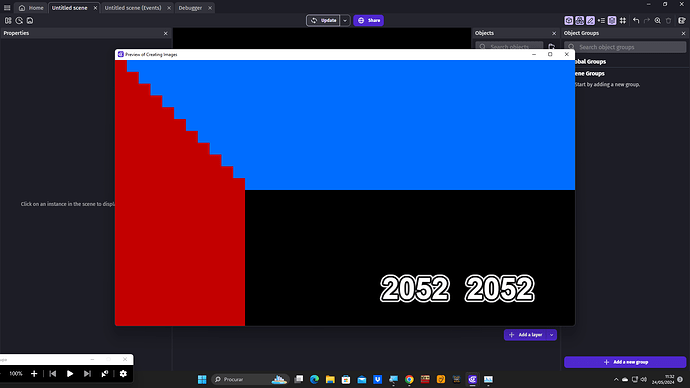
I created a project with where at the beginning of the scene it starts generating a 500x500 world made of 2 Tiles, one Red and one Blue.

The world is being generated in 2 halfs to speed things up, one half is Red the other Blue.

I also have a 2 counters to keep track of how many of each tile has been generated to know how many objects there are in the scene at any time.

The Scene Camera is 1280x720 and the Tiles being used are 32x32 as standard, if any of this changes ill say it.

Base Performance with no Events (Other than worlds generations)

  • 2000 Red 2000 Blue 7.00ms mostly coming from the Render at 3.50ms and other small things, the actual events where at 0.80ms

Bellow is what the screen looks like… most of the Tiles are off screen, this is intentional to see the difference between on and off screen, or how the total of object on scene affects performance.

Testing for Collision between Red and Blue
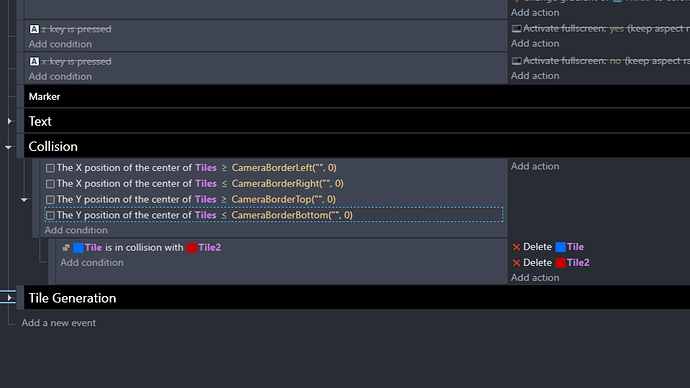
I made a collision check event, and if Red and Blue where colliding, then those tiles would get deleted.

No on screen restrictions:

  • 600 Red 600 Blue 37.00ms Render 0.87ms
  • 1000 Red 1000 Blue 150.00ms Render 1.00ms
  • 1500 Red 1500 Blue 374.00ms Render 1.20ms
  • 99% of latency is coming from the “Collision” event

On screen restrictions (Only tiles on screen get tested for collision)

  • 1500 Red 1500 Blue 10.00ms Render 1.00ms
  • 7.50ms comes from the “Collision” event

This goes to show that you should always limit your events to “On screen” only! …and doing so i quite easy, bellow you can see how i do it.

DO NOT USE THE “InOnScreen” Behavior, that thing is absurdly expensive in terms of performance, use my method instead, it barely costs any latency.

  • This test also applies to anything else that “Checks” an object, like for example “Distance between 2 Objects”, even the tiles off screen will be tested against and if you have a lot of them… then say good bye to performance.

Keep any and all “Checks” to screen only unless under specific situations that you might need to adjust to… like checking how far from the end level flag you are, or from an out of screen checkpoint… other than that, stick to on screen.

Testing if theres a difference between Showing, Hidden and Transparent Objects.

Render results

  • BASE No tiles, just a black screen with the text counters… Average of 1.90ms

Latency at 3000 total Tiles, in and off screen

  • Average of 3.41ms Showing
  • Average of 2.12ms Hidden
  • Average of 3.20msTransparent

Now this is interesting… Hidden objects dont seem to get rendered while transparent ones do… Think were making some progress

A pixel is a pixel, lets test different object sizes within the same filled up camera

  • Using a 1280x720 resolution, and entire screen filled with 32x32 Objects, lined up in a grid, take an average of 8.00ms in total, 4.50ms coming from the render alone.

The only other thing on screen is the tile counter, ill leave these in for consistancy.

Now lets Zoom the camera in to 2x, essentially making object 64x64, still filling up the screen completely.

The tile counters are still on screen, but not zoomed, they are in their own layer.

  • Using the same resolution, and having every single pixel covered, the latency droped to 6.00ms with 3.00ms coming from the render!

Seems that by zooming in, the pixels on screen arent the same. I was under the impression that by zooming in, things got “scaled up”, but thats not the case, the pixels just get bigger… and thats a big deal!

Wonder what happens if we use bigger sprites… lets go up to 64x64!

  • With 64x64 Tiles and no Zoom the total was 5.50ms and the render 2.10ms

  • With the x2 Zoom using 64x64 Tiles the total was 4.65ms render 1.45ms

THIS IS MASSIVE! A pixel is NOT a pixel, bigger objects take less rendering than smaller objects, and then using the camera zoom, we can improve our performance even more!!

To me, logically, this makes no sense… a pixel on your screen should take the same performance, but it dosent, using bigger object is way better for performance…

Wonder if its because of the collision mask… lets test!!
Lets use this as a base:

  • 64x64 Tiles and no Zoom the total was 5.50ms and the render 2.10ms

Ill make the collision mask 32x32 and then test performance again…

  • Nope… Collision masks have no performance impact, exact same results, even tho the mask was half the size.

No idea why bigger object perform better then… maybe its something to do with the engine having to calculate the actual number of objects and not what their made of.

Essentially… The less objects the better, but if youll be using a lot of them, better to make them big!

Just because i can… Lets see what one single, screen wide object does for performance.

  • A single screen wide 1280x720 Object, took a total of 1.80ms and for the Render 1.50ms

This further shows that a pixel is not a pixel in GDevelop

So far my conclusion…

  • Keep any and all logic to On Screen only
  • Use as little objects as possible
  • Fill in the gaps with big Sprites
  • Having less Sprites but Bigger is better than More but Smaller
  • Use Camera Zoom if possible to increase performance

Trough all this the CPU, GPU and RAM barely get used.

If i think of any more tests to do with this ill post them here!
1 Like

Added some more testing and conclusions!

So far the most mind blowing part is the “Hidden” objects being different from “Transparent” or “empty” sprites.

Ill be sure to hid all invisible tiles from now on!

For context on the hidden v opacity difference:
“Hidden” is telling the renderer to not process the object’s visuals at all, including things like animations or effects (unless you toggle on the advanced setting on the sprite object to keep rendering when not visible)

Opacity is just saying “set the alpha level to 0”. All rendering is still happening, the rgb levels are still there, just alpha is 0. That still takes up the same nearly the same level of gpu/memory resources as if it was opacity 100.

The same is true in something like Photoshop, disabling a layer will reduce the memory usage, setting a layer to transparent/0% alpha doesn’t materially impact performance.

For context on the “isonscreen” extension, it does exact calculations to take into account things like rotation of aabb boundaries of the object, or rotation of the camera, etc. That level of accuracy requires more calculations, which will definitely take more performance than just checking the x/y position via an event. Just depends on the use case on whether you should use it or not.

2 Likes

I got one last nugget of information for the day!

The root cause of slowdown is Object Count

  • I tested the 50x50 grid of 64x64 sprites with the camera all zoomed out, the result was Total of 9.00ms and render 5.50ms
  • Then i tested the oposite, no zoom, same grid of 50x50 but with 8x8 sprites… the performance, exactly the same 9.00ms total and **5.50ms" render.

Even tho using bigger sprites is still the way forward in terms of performance, the big thing slowing down GDevelop is the handling of Objects.

There seems to be some sort of real struggle to handle Objects in a scene, maybe this could be looked into?

I really dont know how to deal with this…

I quite literally need a lot of objects to have a procedural generated world, thats how it works, but having a high amount of blocks destroys your performance.

Its not even that high of an amount, i dropped my main project to a 50x50 world, and its still aweful, all of the latency is coming from “Objects” pre and post events.

They also need to have the platform behavior, but that makes things worse… You could say to disable the ones that arent being used or in view, but to do that, you need to do a constant “Check”, either for collision, distance, is on screen, something, and that check will be multiplied by the objects… goodbye performance…

Its actually better to leave the behavior on then to make an event to turn it off, thats how silly it is…

I really have no idea how to deal with this.

Im starting to think that this is a just an engine flaw, it cant handly a scene with above average object amounts… and again, by that i mean a 50x50 world.

The lowest i could get the 50x50 world is around 12.00ms, and thats without enemy AI, inventory, items and so on… just the world.

While I can definitely say that large quantity object selection in events has always been one of the most taxing things from a logic performance perspective, that’s just due to how lists have to be built on-demand when addressed by events, and not rendering the objects, and even then not to the extent you’re experiencing.

I just did some tests and am not seeing anything close to the numbers you’re seeing, so something may be specific to your set up or your test project.

My test:
I loaded up the procedural generation example, set the grid to 50x50 then ran the preview with debugger, and regenerated the view 5 times after loading and starting the profiler.

While regeneration itself will take a second (as with any procedural generation, hence why games like Terraria/Starbound/etc pre-generate their maps at first load and/or build them out in chunks)

With a 50x50 grid the profiler is only showing objects taking 0.70 ms.
Setting it to 100x100 only puts it at 1.30ms, so it’s not logarithmic/multiplicative increases, either.

Unfortunately, not much else I can help point you at why you’d have such heavier impacts, this example even manually adjusts every single object upon creation (sets them to a new animation/opacity at random).

1 Like

Somethings up, i dont think that project is a good test

I just ran it and i got something similar, 50x50 gave me around 2.00ms (top value) on object while 100x100 gave me around 3.50ms (top value)

at 100x100 it took about 11sec to load, and its all being build off one single Origin

My project, using basically the exact same events, but being generated of 2 Origin points not only gives me 9.00ms total, but it takes about 30sec to load up…

something up…

Also, @Silver-Streak are you adding up all the “ms” from the objects?

As in Pre events, post event, pre render and so on.

Because at 100x100 on the example project 3.50 is only the top read, then theres a bunch more bellow totally around 6.00ms or more.

I can’t really troubleshoot any further/provide more guidance since I don’t see the times you’re experiencing, but to ensure I add the necessary context: Yes I’m adding all object rendering times.

I would also add context the above times are from my 5+ year old laptop rather than my desktop PC, just to ensure I was using the least powerful machine in the house.

1 Like

Hello, Magic :cookie:

I use this type of logic in my platformer game. It’s been a while since I tested the profiler and saw that it was worth it. But in my case the phases are horizontal or vertical, which means I only need to compare the X or Y distance between the objects and the character. I use a timer to do this every 0.5 seconds and any of my enemies have the Platformer Character Behavior.

But we have to be careful when disabling things. For example, in the second phase I created doors and rooms and obviously needed to add in the logic that they should be reactivated as soon as the character transported to another location. Another thing was when the character was falling from great heights and reaching the speed limit, sometimes he passed through some structures because they had not been updated. Anyway, I remember that in my tests using a timer it was worth disabling certain logics.

1 Like

I just realized that the difference was the platform behavior.

Im doing some testing with smaller tiles, and before i added the Platform behavior, the tiles were taking up 4.00ms, after i added in Platform, objects now take up to 10.00ms.

Heres my final conclusions for the moment.

  • If making a really large project, like creating a world sort of like Terraria or Minecraft, you can used the usual tools, such as the platformer and platform, its best to create your own logic that only checks for very specific moments and not a constant check like the platform behavior.
  • Objects can be left off screen, even if not being rendered, a system needs to be made that after the world is created, objects get stored in variables and then deleted to be completely culled from checks and processes.

Seems logical really, i just thought these tools could be used for everything, but thats not the case, their more like quick time savers that you can use for more basic games, but as the project gets bigger in scope, we should start adjusting with regular logic and move away from certain behaviors.

For now ill just make a small scale minecraft style platformer, just to show people how to do this stuff, and ill save the big “Terraria” style for later :slight_smile:

This was still very informative and i learned a lot testing this stuff!

Magic Biscuit - Thanks for your analysis on this. I have built a game example explicitly for the purpose of stress testing GDevelop and finding how different objects and events affect performance. You can try it out here:

My guess why you see low performance is because you are using tiled sprites. For some reason, they are the slowest object by a big amount. Try using sprites, they seem to be much more performant.

Also check out the different types of conditions for collision checks in my example. Physic collisions are the best performing, and “separate two objects” is the worst.

2 Likes

That’s a bit surprising. I would have thought they would be similar or non-physics slightly better.

I am curious if some of the physics collision detection is offloaded to another part of the physics behavior. I’m curious how similar projects with and without the physics behavior would perform.

I’ve seen a lot of people say this. Maybe GD needs to try to optimize them. Do you know how 9 panel perform. Same or worse? Although, for me 9 panel don’t work correctly. I get break lines in the graphics. IDK if it’s me or GD.

2 Likes

@tristanrhodes Where did i mention i was using tiled sprites?

I know how those work and that would be insane, im using regular sprite for my testing.

Ill have a look at your game example and see how it goes :slight_smile:

You are da man! I just checked your game example and its awesome!

So… When it comes to sprites, everything runs at 60 FPS solid, EXCEPT for when i check collision.

Simple collision drops me down to 30 FPS, and seperate objects brings me down to 14 FPS

Physics collision stays at solid 60 FPS no matter what, even waking up all the objects!

This is nutts!!

Think you literally just cracked the code!

Im gonna try to change my new Minecraft style game to using Physics and then upscale the heck out of it and see how much smoother it runs.

This has seriously got me pumped for more testing, i hated how constricting this whole thing was feeling, but using physics might just crack the lid open!

Thanks @tristanrhodes ill report back and let you know how it goes! :smiley:

Hear me out on this…

I think there might be something fundamentally wrong with how objects, collision and coordinates are handled in GDevelop and this could worth looking into.

What i mean by this is the fact that when you check for collision, the engine dosent check if the object has anything inside its collsion mask, it checks all the objects it checking against and their position, even the ones off screen.

When testing against if a point is inside an object, this dosent happen and performance is nice and smooth.

Collision checks have almost the same impact if not the same as checking for distance between two objects, which is kinda weird i guess?

Im strictly talking out of feel and experience, as i keep saying i have no idea how the engine actually works.

But this stuff really does seem like it needs a revision instead of trying to implement new features.

New testing… AND… Nope.

Back to my initial conclusion.

I made my project Physics based, super sized it and… it does run smoothly at 60 FPS.

Now that might seem like a win, but heres the thing, i have no idea what the heck its actually going on since the profiler wakes up dormant physics objects.

Is there an option for that im not seeing?

If im just wondering around the world, FPS is solid, the moment i run the profiler, it drops to about 45 FPS.

Because of that, im scrapping the idea, i dont like the idea of doing a bunch of work without being certain of the benifits.

Then i went back to trying to disable the Platform Behavior

…also no dice.

Disabling the Platform Behavior increases object latency quite a bit, but the events that you need to do so, cost WAY more then the difference, whice makes the whole thing pointless.

Iv tried doing it in different way, checking if the platform was on screen, collision, point inside object, distance, any and all check with and witout gating booleans, all sorts, non are efficiant.

So its back to making smaller worlds that are easier on the engine.

Physics might be the solution, but untill i can see actual latency number to compare, ill opt out.

Just because i was curious…

I super sized my project without physics, it ran around 60fps no issue now for some reason, but when running the profiler, it tanked the fps down to around 45, same result as when using physics…

Conclusion?

Back to the original, ORIGINAL conclusion, stuff just be random in GDevelop.

I did learn quite a bit about optimization running all that stuff and @tristanrhodes even made a pretty awesome stress test game for us to learn from.

…but im kinda done, im just gonna assume from now on that, it is what it is.

…or maybe its just my rig, no idea why it could be, but who knows.

It could be, or could not be. But I thought I would relay an experience I once had with a desktop which used AMD graphics.

I was getting inconsistent performance in GDevelop. And I thought it might be GDevelop. But when using GPU-Z, I learned that this particular machine had aggressive power-saving on the GPU, to the point where I could actually see more performance by adding a bit more of demanding stuff to the game, because it caused the GPU to clock up more, which actually resulted in more performance.

Basically, I could be wrong… but I see this as a graphics driver issue or bug, at least when it came to that particular machine.

I now use Intel graphics instead of AMD, and so far, I seem to be seeing good stability. Although, I’ve also seen machines with AMD graphics that run GDevelop well.

I thought of that too.

I already went into my graphics setting and set everything to high performance, no change what so ever.

Theres people with high end graphics cards having performance issue in GDevelop, so fairly certain that isnt the case.

GDevelop is more based on your CPU and RAM, not so much on the GPU.

The GPU is still used to load up your sprites and such but its all basic stuff, it dosent work the same as when you play games made in Unreal Engine for example.

As long as your GPU has enough memory, you could run GDevelop games on pretty old hardware, its the CPU and RAM that really do the heavy lifting.

EDIT:

On the plus side… If i can make a game run smooth on my rig, im pretty sure everyone will have a good gaming experience in my games, no matter their rigs.

Maybe if i overkilled the speccs i would overloook performance and give people a bad experience, so… Silver lining and all that :stuck_out_tongue:

1 Like