For data visualization purpose, do you know how to make data table and chart/graph?
data table: with line of headers, lines and columns of data. eg:
Main charts:
-
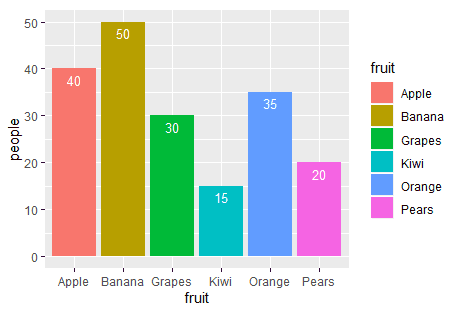
Bar chart (vertical or horizontal). eg:

-
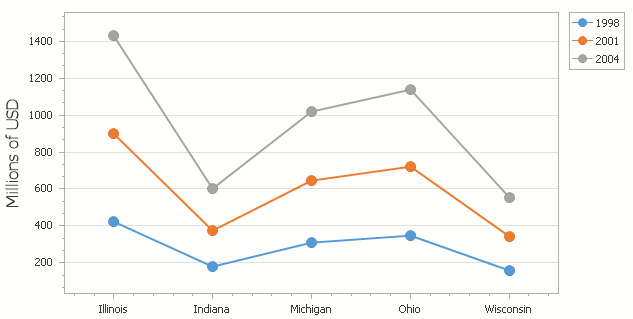
Line chart. eg:

-
Pie chart. eg:
For data visualization purpose, do you know how to make data table and chart/graph?
data table: with line of headers, lines and columns of data. eg:
Main charts:
Bar chart (vertical or horizontal). eg:

Line chart. eg:

Pie chart. eg:
Nobody knows how to do data table… really? ![]()
Oh we do, but we haven’t got round to answering.
Are you after how to visually present it, or how to store it? Because the two are quite different.
Also, GDevelop isn’t ideally set up for this. It can be done and will take a bit of work, but there will be other frameworks that could handle statistical tools al lot better and faster.
To present and prioritize data, which are values of variables and /or structures.
I am not satisfied with the table and the chart I made and I was wondering if anyone knows how to do better.
What are theses frameworks? Can we integrate them into a Gdevelop game?
That’s quite a bit of functionality in itself. Sorting could be done at the variable level. And the basics of it will be 2 nested loops.
But the presentation could be a handful. Will the cells be fixed or dymanic width - How wide will the columns be and how high for the rows? Will they change dynamically if the data takes up more visual space than the size of the cell it’s going into? Will the cells in the same column then get resized? Will there be word wrapping, truncation, ellipses etc?
They’re not ones that can integrate into GDevelop. I’m thinking more like Flutter, React, straight HTML and so on, where table objects exist and do a lot of the presentation grunt work. If you need the tables in a GDevelop game, then those frameworks are no use. But if your app is just to present the data, the other frameworks will a better option for this rather than GDevelop.
As my game contains a lot of data (variable value and other data) that influences the gameplay and the player’s choices, it is preferable to present them in a table to have a global overview and guide the player in his decisions