I’m doing a turn by turn game.
I have two scenes. First — where you can analyse stats. Second — chose options to increase points for stats.
Player goes to the second scene, choses a combination of options for the current turn. Then goes to the first scene and presses END TURN button. The system calculates points and adds to the ones earned before. Then repeat.
The problems i face:
- I try to store data of each turn in a global array. But it works as a single variable, not multiple. How do i put points of each turn in array like this?
- Turn 1: 10 points
- Turn 2: 15 points
- etc
-
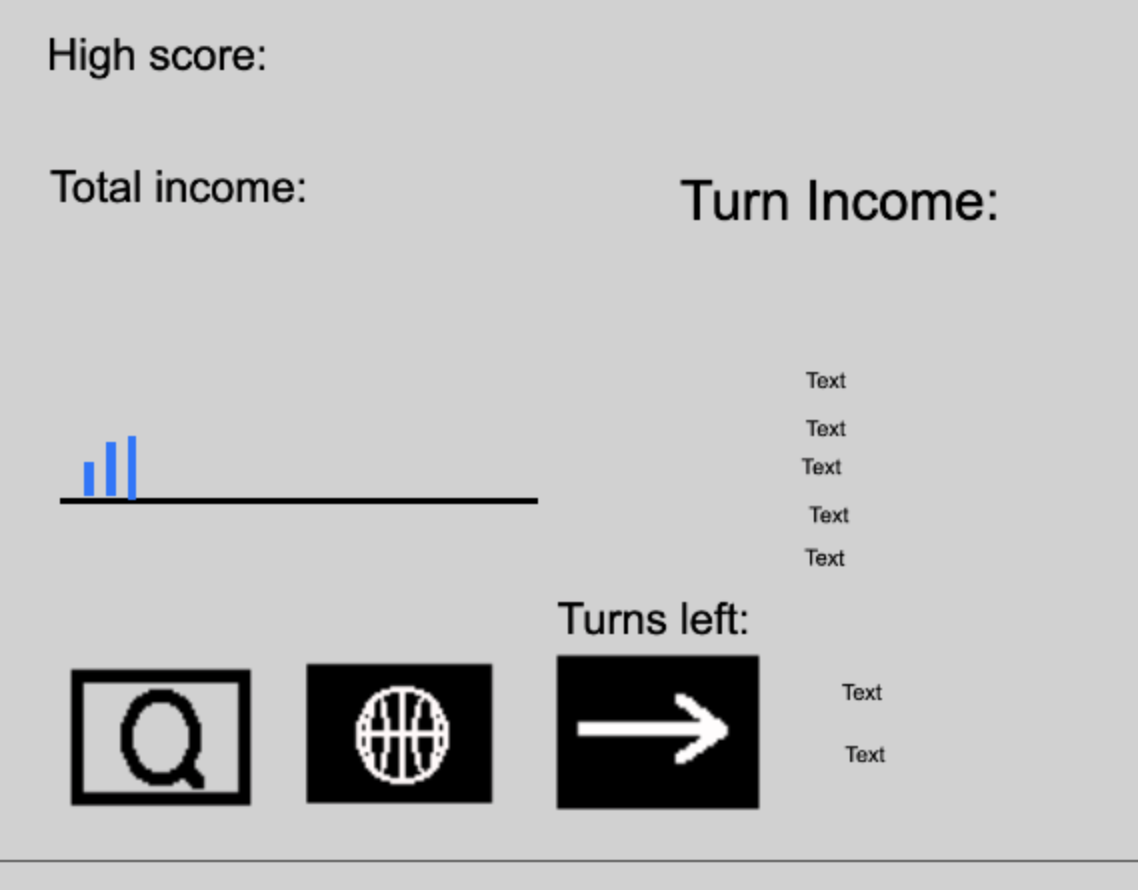
I want to make a visual column graph to show the player how his points grow. For each turn i want a column to appear. Graph should represent all previous turns. If i’m on turn 5, previous 4 should be seen.
-
If i go to scene two to change options to gain more points, scene one forgets the chart and it disappears. How do i make it remain during the whole game?