How can I debug frame rate Hick-ups? Like, if my statement above is right, the average FPS is actually very good. But it constantly drops down to 31 fps and then goes back to 61.
I’d looking forward to someone answering our first question - there’s scant information to what the profiler actually tells you.
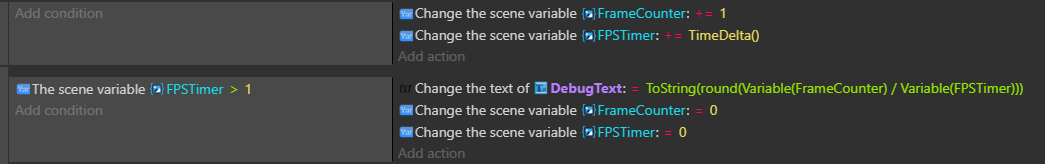
I found a similar issue with the variable fame rates. However, I run a timer and increment a variable every frame, resetting once the timer exceeds 1.
I found that the browser was interfering quite a bit. Check task manager to see what’s hogging the CPU & GPU.
I also found that using ‘Repeat for every object’ conditions seemed to hammer the CPU, as does sprite masking.
Also, if you put your events into groups, then they come up in the profiler. You can then narrow down which events are taking a disproportionate amount of CPU.
I found a similar issue with the variable fame rates. However, I run a timer and increment a variable every frame, resetting once the timer exceeds 1.
What do you mean with this?
Check task manager to see what’s hogging the CPU & GPU.
Found nothing special. In GPU 3d tab stable 20% usage, CPU also stable 15% usage from the game. Same with default platformer example. So I don’t understand the hickups in mine.
i have the text in the scene already. i had attempted just the 1/TimeDelta() and it showed up but i was looking for more of the accuracy that you have.
@yoloyolo Please don’t revive old posts - this one is more than 2 years old. You have also already opened a topic on this problem in the forum. making-my-game-upload-and-run-faster