The other post was getting a bit big and all over, so im gonna make on last post about this top and then im done, im sick of doing testing without any sort of confirmation, feels like doing empty work.
ORIGINAL POST:
IF ANYONE IS HAVING THE SAME ISSUE: Please leave a post bellow with your experience.
So…
Iv been having the most random performance out of GDevelop, both in the Preview and Compiled game.
Some times the performance is stellar, perfect FPS, no lag, everything working as intended.
Other times, the performance goes down by quite a bit, lag happens, fps in completly unstable.
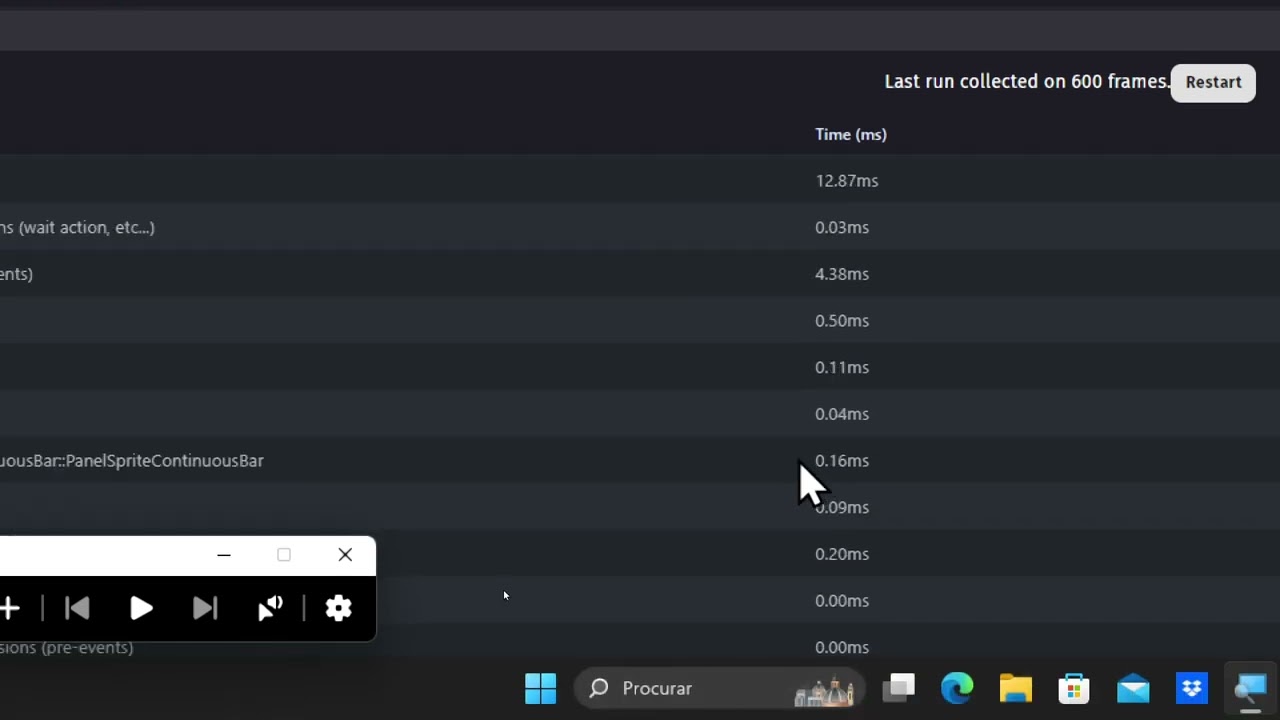
When the game is running smooth, the total “ms” on the profiler is around 6 to 7.00ms.
When the game is running bad, the total “ms” is anywhere between 12.00 to 15.00ms.
Honestly, it feels as if for what ever reason the game is running twice at the same time, and no, im not doubling my events.
Theres also some sort of gap on my “events” on the profiler, all my events are under one main event group, that one runs at about 1.50ms, but the “events” on the profiler shows around 2.50ms.
When the game is running badly, the events group shows something around 2 to 3.00ms while the “events” shows 4 to 5.00ms.
This happens randomly, some times you open the preview and everything is smooth, then you close it, reopen it and now everything run like crap.
When i was making the videos i did notice a trend, every time i close the Preview, tabbed out of GDevelop, opened OBS and then restarted the Preview, there was a good chance that it would run much smoother… why? No clue.
So i tested this, and yup, it kinda works, about 6 to 7/10 it works, and then you close it, reopen and it slowly gets worse again… weird.
I made a little video showcasing some of the randomness that goes on.
In the video, i show you a first result i made when the game was running well with a total of 7.00ms, the second test was over 8.00ms and then the one after was about 12.00ms.
All of this is with the same events, under the same conditions, on the same scene, with the same everything. Its just random and weird.
Also, as far as i can tell, its not my computer bottlenecking stuff, my CPU is barely being used and my RAM usage is under 60% with everything running.
I also seen the memory usage of GDevelop go all over the place but have no real impact, iv seen it go anywhere from 250Mbs, to 800Mbs and have about the same performance, so i dont think thats an issue… I even cought this on video, that i posted on the original thread.
One more things, while i was poking around, i noticed the Empty Events, Comments and even Empty Event Group Labels impact performance, and not by peanuts, im not talking 0.01ms, im talking 0.30ms worth of ms from a handfull of comments, something i also showed in the original thread.
anyways… heres the latest video, just showing some of the randomness iv been dealing with, iv tried to not make it too long so i dont bore anyone.
Sorry if i sound upset, its because i am.
