Hello. I am using a translator in case there are spelling errors.
I am developing the game with javascript. But I do come across small bugs that happen sometimes, and the game crashes. As is normally done when developing a page, the console is queried for the error. But in this case it is not like that, I get the GDevelop status, copy errors of some photos. Among other things, they are part of the program. But it does not throw me the error that is produced by writing the code in the blocks of the javascript events.
I’m new to this game development thing. And I would like to know if someone helps me with that. This error may be something simple, or even newbies, but I ask you to help me.
Thanks.
Remember that I am using a translator. In case there are typos.
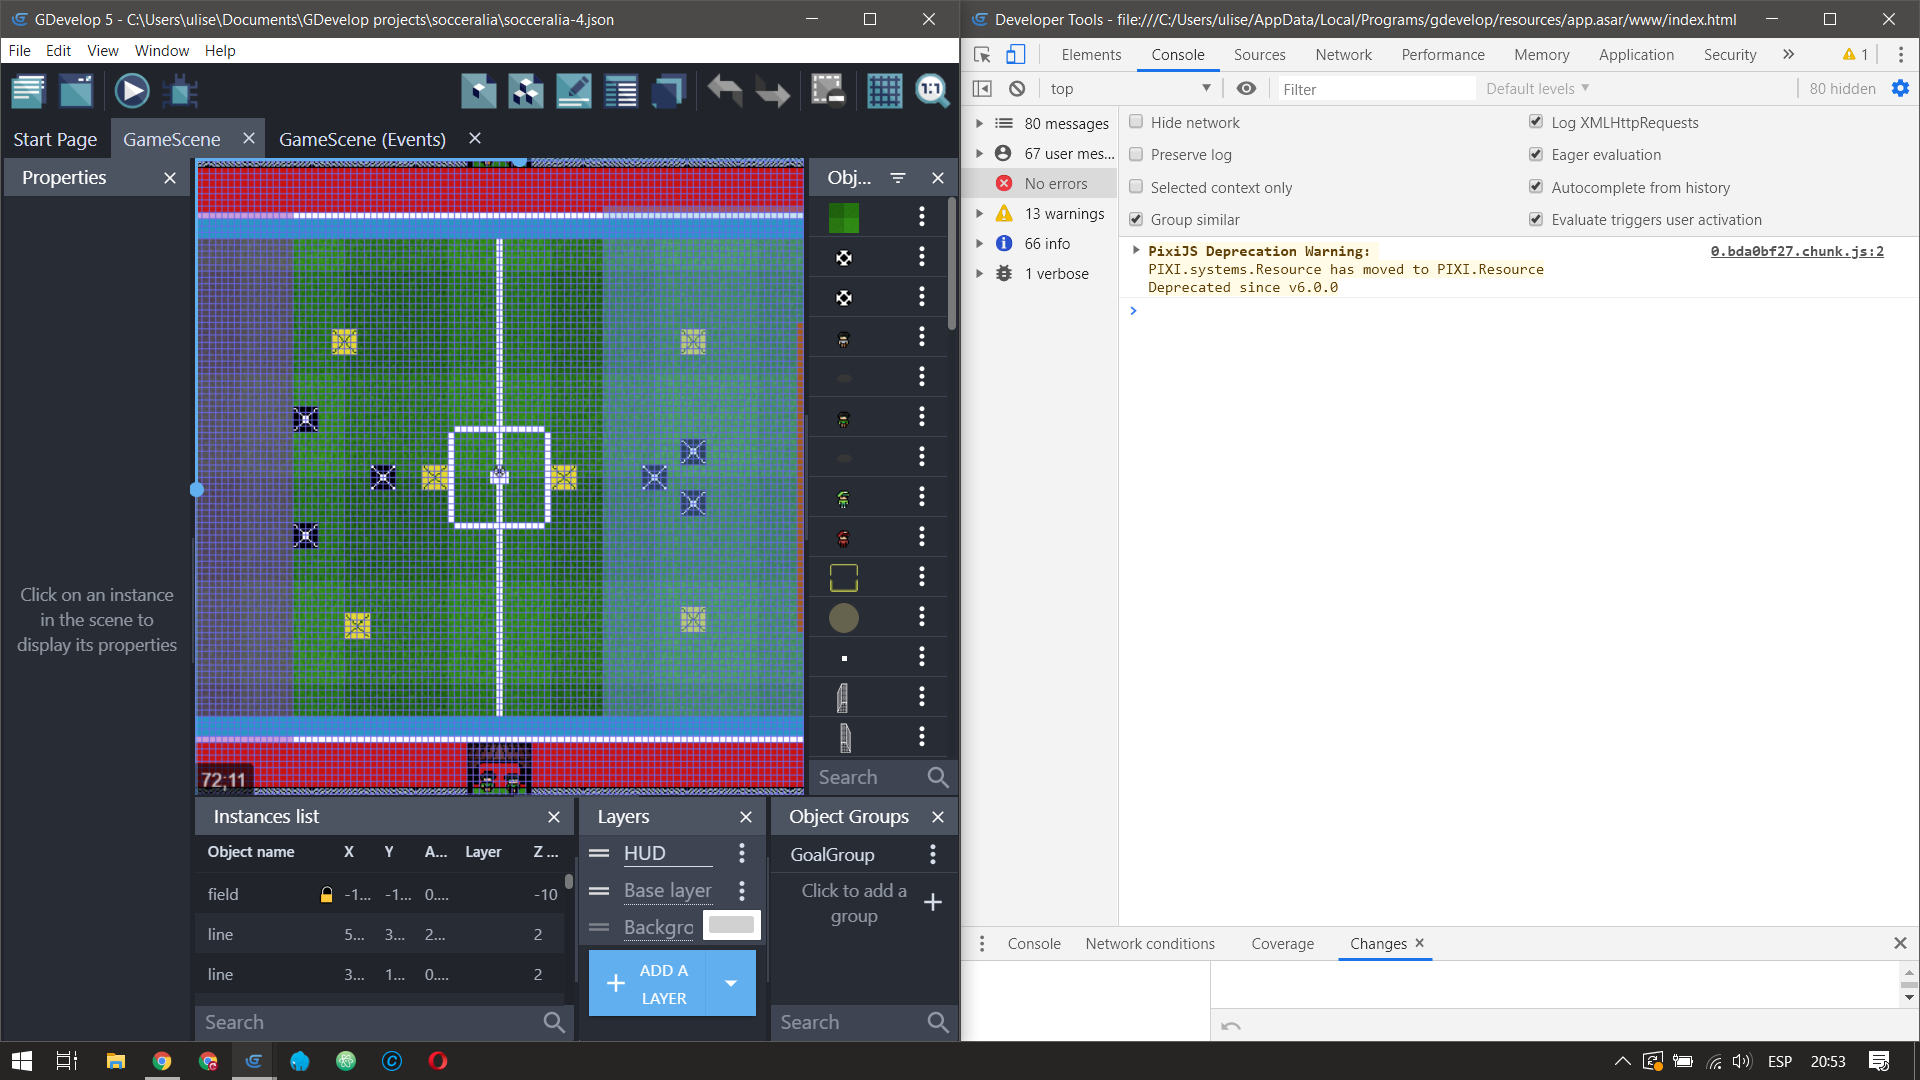
Hi you can open the console from the View menu or Ctrl+Shift+I (i)sland
and the debugger can be launch from the bug icon aside of the play button
Hello. Thanks for answering.
Yes, sure, I can open the debugger and the console. I just don’t know how to use the debugger, so I want to see what the errors are from the console. But since the problem is that the console shows me only errors from GDevelop as such, and not from my lines of code.
Sometimes, I write a lot of code and when I go to execute it it does not start, and I have to check letter by letter to see where I went wrong because I do not know where the errors appear in my lines of code in the console. 
Just like in a browser with websites, different tabs/windows have their own debugger. Therefore opening the debugger in the GDevelop IDE will debug the GDevelop IDE, if you want to debug your game open the debugger in the game window.
Note also that GDevelop is not made to be used via JS, many parts of the API won’t be user-friendly, many features are inaccessible, there is no object selection nor any other benefits of the event sheets.
2 Likes
Aaa agreed. Now I understand. Thank you very much for your time and explanation.