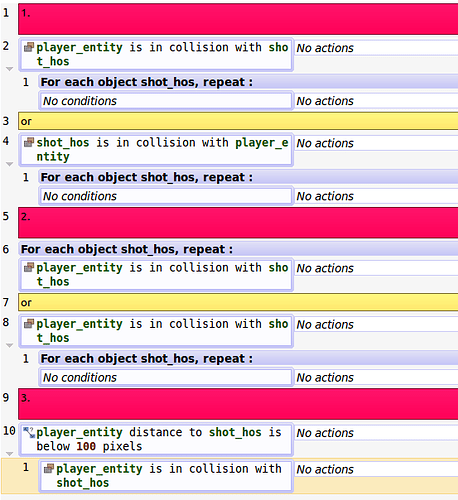
I dont like using “distance between two object” to simulate colision, i’ve never understood from what pos(x;y) the comparaison is made… I guess it’s object.X() and object.Y(), so if the object is big, or if it could haves a complex collision mask, it’s not that good… And at last i think collision is better than distance checking, because distance checking in a “for each” loop will make distance comparaison to always run… It’s suppositions, and without advanced knowlegde of source code, it’s hard to know… Only 4ian could answer this i guess.
I noticed little performance gain by making less complex collision mask for basic collision condition.
From my own experience, i would only use this (according your actions are on specific “shot_hos” object after collision) :
For each object shot_hos, repeat :
- shot_hos is in collision with player_entity
All my collisions with interactive objects (ennemies, or physical objects) are based on this, and i use this as routine from performance tests i’ve made with gdevelop v3, 3 years ago (native platform ofc).
Maybe try all the different scenario, with a lot “shot_hos” objects ,and check the performance monitor, and charge of events for each scenario.
I have a performance test in my game where i spawn 500+ objects (and each have several other objects attached (light objects, particles objects), all with AI active. Anytime when i code a new type of interaction (for example a burning effect, with individual duration timer and multiple particles effects), i check the performance : 1) in preview, the test is passed if i have 30+ fps 2) in compiled project, if i get stable 60+ fps.
Then, we have already talked about optimization tips, but take a look on render time (in ms, for visual renderer) : sometimes, optimizing assets can have a huge impact on performance, for example with a 500+ objects on the scene, from bad to well optimized sprites, the render can oscillate between 25 and 5 ms.
Edit : ofc, it also depends on hardware, but always test the compiled project on different hardware. Preview mode can really have bad performance on crappy computers, because the IDE can use a lot of memory. Try also to make your test in fullscreenmode. If you have a laptop with dual gpu (nvidia optimus), you can also make you tests with both integrated gpu and dedicated gpu.
Edit2 : i guess you already use it, in a text field => ToString(1/TimeDelta())
With it you’ll be able to check the number of fps directly the compiled project.

