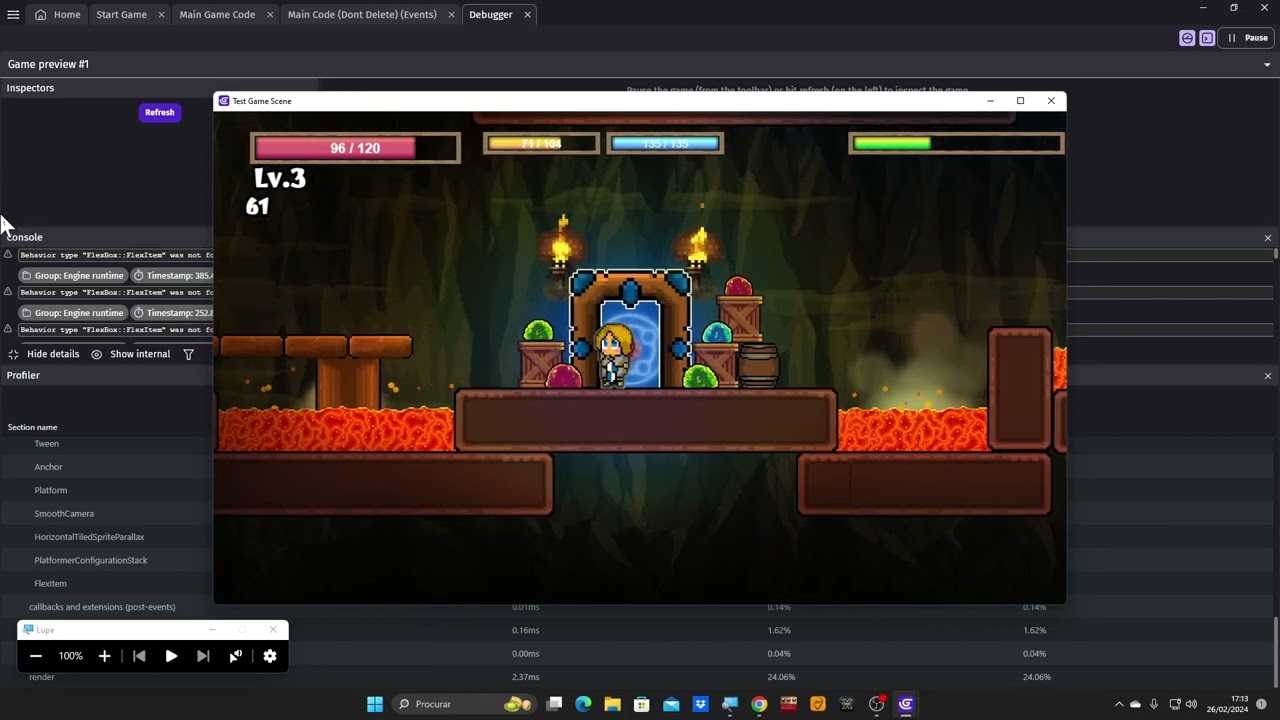
[MORE UPDATES]Performance Issue On Boot Up,,, AND Event Comments, intended?

I just noticed one more thing, maybe someone can explain this one.

Desktop GDevelop remembers your tabs even if you dont save the project before exiting the software.

Try it, open the Debugger, then close down GDevelop without saving and then reopen it… The Debugger will be there, its like some stuff is being saved to the cloud or being stored in memory for a while? idk…

Btw i save everything localy on my computer.

I have noticed that in some of my previews, the ms are higher than others without any difference that justifies it (they reach almost double the usual value). When I restart Gdevelop, it normaly return to the usual ms values ​​again. My game is far from the threshold of approximately 16 ms that needs to be exceeded for the FPS drop to be visible. I assumed it had more to do with a bug in the profiler than a problem in the game or Gdevelop itself, but I don’t know.

Just to be sure, are you using the FlexContainer Extension? They found out it had a memory leak and slowing down games on scene changes.

Other then that, i feel you, i have the exact same issue and im going nutts trying to figure it out…

Iv gone as far as to turn off literally every event that wasent on screen but it makes no difference, iv disabled most of them and still no difference…

Its something with the rendering i guess? …i even turn off every particle emitter thats not on screen…

gonna keep poking around today to see if i find anything else, if not ill just give up and assume its something engine related and wait for improvements…

I just discovered that everything on the Event Sheet impacts performance, even simple “Comments” or Empty Events pile on the performance in a big way!

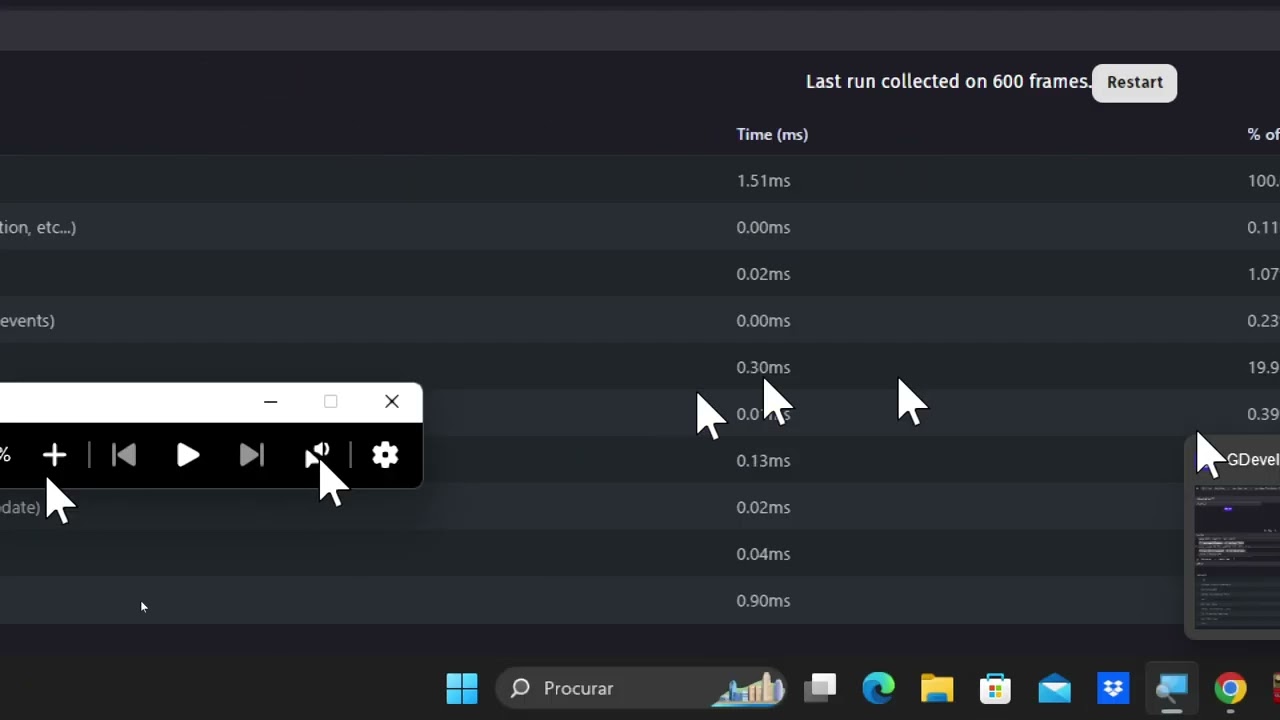
Heres my testing and proof, watch it through and youll see how just a handfull of comments and empty events add to an extra 0.30ms on a completly empty scene.

On my actual game, this extra performance can add up to as high as double the original events, in my case, and extra 2.50ms

Is this intended?

Just did some more testing out of curiosity and empty event groups increase your “ms” as well.

On the profiler, it said that the “Empty Event Group” was 0.01ms, while the “Events” was 0.14ms

I had 5 “Empty” event groups on the event sheet and nothing else.

I also did another empty scene test with just a single empty event and the events ms went up to 0.32ms

When the event sheet is empty, its always 0ms

The performance is all over the place with the results… Same everything, diferent results… its nutts…

No, I have very few extensions and nothing about that.

You’ve done a great job with all of this. Thank you!

I’ve mentioned a few things about this on the forum but didn’t get an official response (Lower performance on different previews ,also Android Performance Issue even with 2 Simple Small Physics Objects). I had no idea that empty events consumed resources.
What confuses me is that you have around 0.70 ms of rendering on an empty screen. I think there must be some weak point in the rendering.

I just cant seem to figure it out, no matter how much i optimize its all over the place, some times it runs at 9.00ms total, some times its at 16.00ms total… for no reason…

The render is one of the things that has the odd changes, along with the objects pre events and then the “Events” that we cant see.

Tomorrow if its still going all over and i have the patience, ill try deleting all the markers, debug tools i made and everything thats not “code”, to see if it makes a big difference.

New UPDATE!

I got rid of all junk from the Event Sheet, all Comments, “Markers”, junk events that were disabled, everything that wasent a part of the game right now, i deleted.

The result was a big increase in performance…

For clarification… i must have deleted over 100 Event Comments i was using as markers, along with a bunch of disabled things i had as experiments.

Getting rid of the junk really made a difference… but the event groups make a difference too, sadly those are harder to delete since they keep everything sorted…

I have a bunch of those too… so sad times…

Theres still a full 1.00ms between my “Real” events and the “Events” tag on the profiler.

Another difference that i saw was on the Task Manager and Memory usage…

Before i deleted all the junk comments, the memory was around 850MBs to 900MBs

Now after getting rid of all that stuff, it sits around 500MBs of memory being used.

Heres the new video of me testing stuff after deleting the comments:

If event groups affect performance then I am absolutely cooked, though I found that my game is unplayable on every browser and the in built preview, but is perfectly fine in firefox LAN preview. When I find time I’ll test to see if external events affect anything, that might be a good alternative to event groups.

Im not sure any more… think the problem is some where else and its an engine issue.

I just booted up and now everything is upside down in terms of performance, its gone back to being bad with literally no change what so ever…

Ill post the testing in a bit, the whole thing is just nutts…

And back to square one…

Last night, like you can see in the previous video, everything was fine, fps was good, it was all good…

This morning, not doing anything other then booting up… Its back to bad performance.

Please watch the whole thing, i got the Task Manager showing so you can see everything thats going on as i play test.

The memory usage from GDevelop is all over the place, Starting at 500Mbs, then going down to 250Mbs, then starting to go up and up untill it reaches the high 700Mbs… for no reason

I really dont get whats going on, its completly inconsistant with itself.

imo your project is so big that could be anything.
to my little experience…i would look at your object and layers, (ligh,glows,shadows fx).
I’ve found (some of them) to be very expensive in performance.
But it may be not your case

Thats the thing tho… my project isnt that big, its just a basic rpg at this point with 6 tiny levels, 1 hub and 1 boss room… is that really all GDevelop can handle?

You telling me in all these years no one really made a game bigger then my tiny rpg?

Thats kinda silly… AND BESIDES THE POINT.

DA POINT: The performance is just random, yesterday afternoon when i made the performance update video, you can see the FPS being always around 60 and never reaching 11.00ms, staying between 8.50ms and 10.50ms… THIS MORNING with no change what so ever… its around the 14.00ms to 16.00ms… why? just because, THATS THE POINT.

Its not my project, its not my machine, its a flaw in the engine.

It just seems to me that people dont really make complete projects and then check their performance to see if its good.

Theres no reason for my fps to be low, something that the engine proves by some times, when it feels like, actually running my project buttery smooth.

I understand what @MagicBiscuit says. It’s not about simple optimization, it’s about a bit random performance. I agree 100% that the majority of those who make games do not usually finish them or they don’t make “big” games, so, they don’t face this problems, which is why they are not interested in these kind of topics. This happened to me many times and I have changed entire codes, having to redo complex mechanics just because I thought they were poorly optimized and they weren’t; the drawback was this random performance.

With these situations you can demonstrate. I was about to redo important things that would require a lot of work. Just by waiting a few days it started working as before (without any code modification or anything). And this happened for both previews and an Android build.

Exactly!

The performance just goes all over the place with no reason, then you think its because of your code, you redo a bunch of work and nothing, then out of no where it starts working well again, then back to poorly, and so on…

Im guessing more people dont have this issue since their projects are so small they never really reach the 10.00+ms where the fps starts taking a hit.

It also seems like older version of GDevelop run better… so… My second guess is that its something they did to the engine to support 3D Games, ruining what they were truely good at…

I really hope they dont keep going down this route and ignore this kind of stuff…

I love GDevelop to bits, thats why im so invested in this, it breaks my heart that something like this still exists…

I really wish i could dig more and just point at it and go “There it is! You can fix it now”, but no real testing i can do will have that result.

Iv done so many tests and all i can tell is that performance is unstable, its never the same, some times its good, some times its bad, something as small as alt tabbing out of the game can send it from good to bad.

Memory usage is also all over, but has little to nothing to do with performance, iv had good and bad performance with the exact same memory usage frrom GDevelop, so its not like its a memory leak or something.

It just feels like sometimes it overloads on start up or something and then stays that way… or it starts well, but if you do anything like tabbing out it will send it downhill…

I really dont know man, i still have no clue about the “missing” stuff from the “events” on the profiler, the “ms” thats not from any event group that a huge chunk of performance and i have no clue where from since all my events are under one big event, so it should be easy to spot…

Hopefully some of this will get to the devs and theyll spot something we didnt.
1 Like

I made this video for something else, but since its a prime example of random performance for no reason what so ever, im adding it here…

It jumps from go to bad for no reason, just tabbing out or restarting the preview either makes performance go stellar and make everything buttery smooth or breaks it… the heck man

Probably in wrong but that laser event Is repeated each frame (while the character Is close)because the laser hit .and probably the sound stack

Try the collision debug action to see if It Is the case. Be wary that It Will slow down a lot the game

The RayCast does trigger every frame when the lava tile is on screen, but even when theres a bunch of them going it dosent affect performance.

The issue here is that, its NOT on screen and its NOT triggering…

The big performance increase comes from the Stop the Sound, even if it only happens once.

I made sure that the RayCasts only happened when needed, and their performance is insignificant, i know this because iv checked performance with and without the event group disabled to see their impact.

The difference was peanuts, the big one is the Stop the Sound…

This was just an experiment, i was seeing if stopping a sound from playing was better on performance then letting it loop in the back, and not only does it seem like its not, but also, that event is crazy on performance hugging.

Since this video has some more performance testing and more proof of just random performance, going from struggleing to straight up perfect FPS and then back down to crappy fps… im posting it here as well

I’ve had to remake so many projects because once they got too big, performance would dip, this is my fourth ambitious project and I’ve made note to optimise it every step of the way, and it does perform better when it performs well, but when it doesn’t it just seems like there are certain areas gdevelop hates no matter what I do, like disabling lighting, removing rotated objects, nothing works other than just reverting.